06 November 2015

Better analysis using Gnuplot

My recent posting using images generated from Gnuplot was rather basic. After examining its quite voluminous documentation somewhat cursorily, I have been able to significantly improve the output.

For example, the impact of tax rates and cost of capital on investment in Class 29 assets is illuminated through the use of colour:

Adding a 2D heatmap with the original 3D chart really does clarify the nature of the impact. By specifying different colours to different ranges of after-tax cost, we can more easily gauge the effects.

Here it is for Class 53:

You can easily see that the colours are shifting to the left, thus showing that the net after-tax cost is generally becoming cheaper.

And for Class 43:


You can note the impact quite distinctly between the three graphs.I have only just begun to explore this particular application, but I am already impressed with its power.

05 November 2015

A follow-up on the impact of the federal budget

Last spring, I published a post on the impact of changes in capital cost allowance rates on the after-tax cost of investment. I attempted to quantify the impact, but I have wondered since about what would happen if the variables relating to tax rates and cost of capital changed, and how to express that clearly.

I have recently come across gnuplot, an open-source program that helps to chart questions like this, and inputted the data. I decided to plot all possible combinations from 1% to 99% for both cost of capital and composite corporate tax rates.

For the current Class 29 framework, the chart looks like this:

There are two things that immediately stand out:
  • as the tax rate rises, the net after-tax cost falls; and
  • as the cost of capital rises, the net after-tax cost increases as well.
For comparison, here is the impact on Class 53 assets, which is scheduled to be in effect from 2016 to 2024:

Note that this reduces the net after-tax cost attributable to higher costs of capital. This is especially important when such costs are weighted for risk.

And what about Class 43, which is supposed to return in 2025? While very theoretical, because of the recent change in government in Ottawa, here is what it would look like:

You can see immediately that the cost of capital aberration returns.For that reason alone, I would venture to guess that that option will never return to the Canadian tax structure.

All of these charts do highlight a major flaw in the current system, which all political parties in Canada have failed to see: as lower tax rates make the net after-tax cost of investment much more expensive, that means that current rate reductions given to manufacturing and small business are actually making it more expensive for them to invest in more productive assets. The UK, probably for that very reason, decided recently to abolish its preferential small business rate, and have opted to bring in concepts such as the "patent box" to assign lower tax rates based on the results of specified investments.

That may well be worth implementing here.

14 October 2015

"The motherboard is fried."

I had some downtime this past week, when the HP laptop suddenly failed to boot. This was unexpected, and I had to take it in for the first time to have it looked at. The above headline summarizes the result. Thankfully, I was able to get my files retrieved, and they now lie on a nice little(!) 32Gb USB drive.

It had served me well for almost five years, and it was just upgraded to Windows 10 last month. That was a smooth process, although it took almost two hours to perform. Thankfully, I'm rather patient.

After investigation, I settled on a Lenovo Windows 7 Pro laptop with Intel i5. I normally prefer AMD chips, but I've learnt that they run hotter and are probably better suited for desktop workstations. That's interesting information to keep in mind for the future.

Within 24 hours, I now have it running on Windows 10, as I was informed that the laptop qualified for immediate upgrade. All other applications I required, in their latest versions, have also been downloaded and installed. They are all legal as well: I am a fan of open source apps, and they operate very well these days! Together with a second monitor, I'm now back in business.


28 September 2015

Corporate stupidity: It's only gotten bigger

The recent news about how Volkswagen gamed their vehicles' software for the diesel emissions tests has been distressing, even causing some serious discussion about whether the diesel engine market itself will survive. The fact that these engineers could devise such software was perversely brilliant, but such abilities could have been better used to work on solutions that could reduce NOx emissions, which was supposed to be the point.

I wish I could say that this type of behaviour is unusual, but it has always existed at one scale or another. Here are some interesting stories I've been told over the years.

Bankers and their ability to handle money


Leaving aside bankers' predictable habits of lending against the security of assets that are ready to tank (as when a real estate bubble is ready to burst), there are other instances that can really make you shake your head. Take in the mid-60s, when the Toronto-Dominion Centre was being constructed.

TD Centre View from Yonge and King

One contractor was given the job of finishing TD's executive offices, where the architect specified mirrored surfaces with bronze glass, which would coordinate with the outer skin of the buildings. To their dismay, the mastic used to bind the glass to the underlying substrate was tainted, which caused the mirrors' silvering to blotch and develop black spots  quite badly throughout the office layout. As the mastic had set, nothing short of dynamite could have removed it, so any resulting warranty repairs had the potential to render the contractor insolvent.

They were ready to face the music when TD's Chairman came to inspect how things were coming along. To their surprise, he exclaimed, "I don't like it! It's too dark in here. I want it all replaced with something lighter, and I don't care how much it costs!"

It was replaced, and, as extras in a contract always fetch higher margins, that year turned out to be that contractor's most profitable in years. They were still laughing about how that turned out twenty years later, when I first heard the story.

Misguided priorities of management


Something a little more in keeping with my line of work always has the capacity to surprise. For instance, auditors' standard practice has always included preparing a management letter at the end of an annual audit which gives points that they hope will be useful for the client. When a former boss of mine (who, alas, is now deceased) was still a hard-working CA for one of KPMG's predecessors, he was involved in an audit for Cochrane-Dunlop, which used to be one of the larger hardware distributors in Canada.

At the end of that particular year's audit, they had assembled quite a list of suggestions to help the company operate in a more tax-efficient manner. However, when they made their presentation, they could not help but notice that the Chairman's face was getting redder as time went on. He suddenly started shouting: "I completely object to what you are saying! I love this country, and I consider it my duty to pay as much tax as I possibly can to support it!" The audit team promptly hushed up, and the meeting wound up faster than they had planned.

Some subsequent history to note: Cochrane-Dunlop went bankrupt in 1987. Its industrial products division was sold to C.N. Weber (now known as Weber Supply), and the consumer products division (which had serviced Dominion Hardware, now part of PRO Hardware) was shut down. It makes you wonder what else there may have been that caused their priorities to be so fundamentally off base.

16 September 2015

A great use of visual analysis

I've always fancied myself to be a visual - even symbolic - thinker, and am always looking for ways to express ideas and trends in that manner, as words can often fail to express what is really going on. I recently came across some work that someone did to explain what happened in the 2010 UK general election as voters shifted allegiances among the three main parties.

For example, here are the shifts by constituency between the Conservative and Labour parties, using Butler swing analysis:


2010UKElectionLabConSwing

You can plainly see that Labour support was eroding almost everywhere in the country. The black constituencies are those held by the Speaker of the House (whose campaign is generally not contested by the other parties), and one where the vote was delayed due to unforeseen circumstances. The constituencies in Northern Ireland are not shown, as the politics there are quite different from those in Great Britain itself.

This analysis can be extended to assess the relative strengths of other parties, such as the shifts between the Conservatives and the Liberal Democrats:


2010UKElectionLDConSwing

Here you can see that the results are more mixed, and hence more interesting. But here is the comparison between Labour and the Liberal Democrats:


2010UKElectionLabLDSwing

When you compare the first and third charts, you can see that Labour support was vanishing across a wide swath of England and Wales, with votes moving to the other two parties. This greatly explains the outcome of that election.

I've taken a look to see if anyone worked up a similar analysis for the 2011 Canadian general election, but nothing is available. Technically, it should not be that difficult to work out, as Elections Canada does provide lots of baseline data online. This could prove to be a useful exercise.

21 August 2015

Reflections on a long-gone enterprise


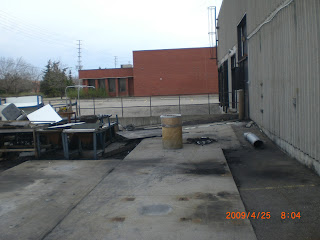
It's funny when you dig up some old pictures, and it makes you reflect on the events that led up to it, no matter how innocuous it may appear to be. The above image is a perfect example, taken of the back side of a business that had been recently shut down at the time.

There are apparently five shipping doors, consisting of three loading docks and two drive-in bays. However, only two of them were functionally available, being the two left-hand docks. Why was the operation constricted to only 40% of its potential shipping/receiving capacity? The first clue pops out when you take a closer look at the driveway under bay 3:


You have to look a bit closely, but there are spikes of rebar sticking out of the concrete, which served to secure a large dumpster that was seemingly always stationed under the bay door.

Bay 4's door was integrated into a large cardboard compactor that was inside, and thus could not be opened at all. In addition, a significant amount of garbage was left outside, which was one of the reasons the space between bays 4 and 5 was cluttered:


From the colour of the asphalt, it is readily apparently that the dust collection system inside (which was piped through a hole bored through the door next to bay 5) was not very efficient in collecting particulate matter, which engendered a completely different round of issues.

Between bays 4 and 5, a concrete pad was placed into the asphalt, on which an external dust collection system was mounted:


The bollards were steel tubes driven into the asphalt, into which concrete was poured. There was a secondary concrete pad poured between the first pad and the building.

The worst damage of all is seen at bay 5:


In this area are bollards, remnants of the same, as well as rebar punched into the asphalt. The upside-down T-bar at the top of the door also served to restrict the height of whatever could enter the building. In addition, there was a sorting line just inside the door, which prevented most equipment from being able to enter in any case. The shelter just in front of the door, which was used by maintenance staff for doing some outside work, did not help either.

The building had to be returned to the landlord at the end of its lease, which was only months away. The lease had a standard term, under which it had to be returned in the condition existing at the beginning of the term, and the changes undertaken by the tenant without the landlord's consent (including the above), known as "dilapidations", had to be removed. I was hired to help monitor the activity that needed to be done to fix all this. There was other work that needed to be done inside, but that is another story altogether!

The bay doors had to either repaired or replaced, to bring them back to working order. The asphalt in the back required substantial replacement, and the contractors really went to town on that:


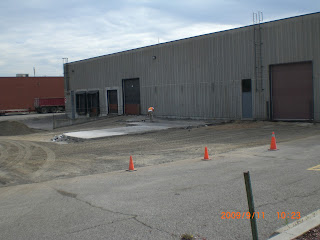
And it really felt good to see the finished result:


But it does beg many questions as to what led to such a poorly designed system such as this. Several factors are quite apparent:
  • The building is ideally designed to function as a warehouse. However, the business was oriented towards manufacturing, which has its own unique requirements.
  • The business was being strangled by its waste collection system. The driveways on either side leading to the front of the building were very narrow, and thus any collection equipment could not be installed there. In addition, no thought was ever focused on using the space between bays 4 and 5 more efficiently with equipment positioned directly on the wall.
  • With logistical capacity at only 40% of what it could have been, material flows both into and out of the facility were needlessly restricted. This had knock-on effects all down the line, which led to the loss of significant contracts with major customers arising from the inability to provide timely shipments.
There were other issues as well, and the industry in question was going through major shifts at the time, but I think the above were at the core of what was going on.

10 May 2015

The latest federal Budget and capital investment

I haven't seen any good summaries on this topic on any of the standard websites, so here is my take on certain aspects of interest to management accountants.

Moving away from Class 29 CCA in 2016


This is rather interesting, in that the new Class 53 for manufacturing and processing equipment (effective for acquisitons after 2015 and before 2025) will be effective for at least ten years, at a 50% declining-balance amortization rate for the pool of assets concerned. This is a bit less attractive than the 25%-50%-25% amortization over a three-year period, but somewhat easier to calculate. Why they chose to move from the one method to the other is still not clear.

Why is it less attractive? It all comes down to simple math and standard capital investment appraisal techniques. For purposes of discussion, let us assume a gross investment (C) of CAD 100,000, a cost of capital (i) of 10%, and a combined federal/Ontario marginal tax rate (t) of 25% (ie, net of manufacturing and processing profits deductions).

The net present value after tax for investing in Class 29 assets is calculated using the formula

$ I \left [ 1-t\left (\frac{0.25}{1+i}+\frac{0.5}{\left (1+i\right)^2}+\frac{0.25}{\left (1+i\right)^3}\right) \right ] $

or approximately CAD 79,282.

Now let's take a look at the new Class 53, with its amortization rate (d) of 50%, subject to the half-year rule. The net present value after tax for that investment would be calculated using the formula

$ I \left [ 1-\left (\frac{td}{i+d}\right )\left (\frac{1+\frac{1}{2}i}{1+i}\right ) \right ] $

 or approximately CAD 80,113, which would an effective cost increase of about 1%.

The feds still maintain that the eventual fallback classification for such assets, for acquisitions after 2025, will be Class 43 at a rate of 30%. As they have been deferring this move for several years now, it remains to be seen whether it will ever come about, but the above formula would then suggest a net after-tax cost of about CAD 82,102, or 3.6% above the Class 29 amount.

The differences are not huge, and Canada's rates for such investments are still probably some of the most generous in the world. The real challenge will be getting Canadian managers to undertake any investment at all, which invites further discussion on our appetite for undertaking significant expansion and innovation. To date, there has been too much emphasis on improving the concessions for small businesses, but it has been argued that such measures constitute a disincentive for expansion, as too much activity is expended towards keeping such enterprises below the thresholds for applying higher rates, thereby limiting cash flows available for productive investments. That, however, is an argument for another day.

Integration of Eligible Capital Property within the CCA system


There will apparently be legislative proposals later on this year to deal with this matter, which will be quite welcome. It's been a long time coming for this idea to come about for getting rid of what was essentially a parallel régime. I look forward to seeing what the detailed measures will entail.

Why don't Canadian businesses invest?

The tendency of Canadian businesses to under-invest has been noted for decades, and the Fraser Institute reported in 2017 that investment f...